Beacon’s supply chain visibility and collaboration platform empowers organizations to achieve more efficient, reliable and sustainable supply chains.
Global Port Performance: July 2025
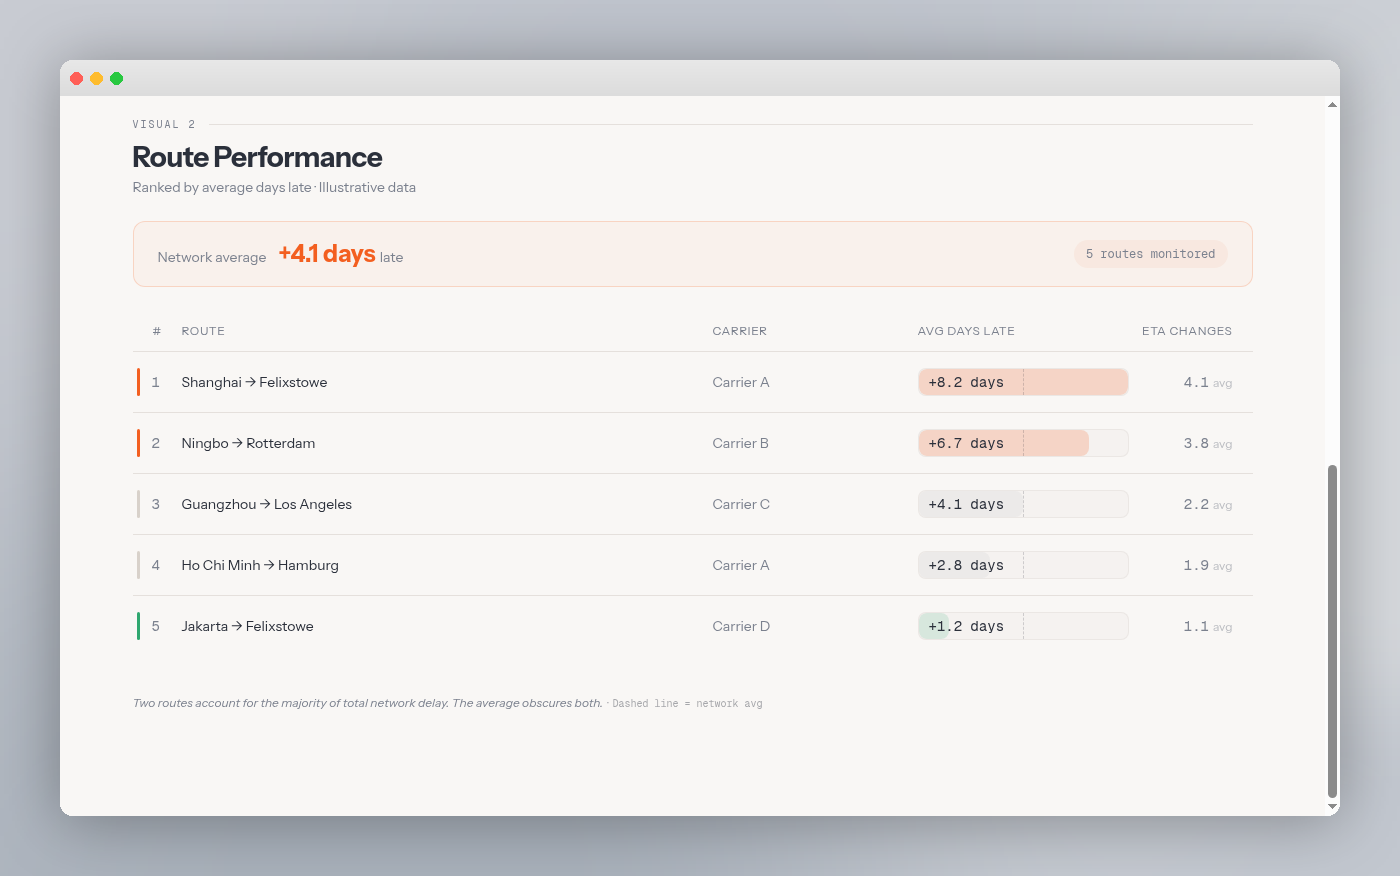
July 2025 showed notable variations in global port berth times, with some significant increases at major container hubs alongside efficiency improvements at others. According to our July 2025 port performance data, North America recorded the largest regional average increase (+0.14 days) while individual ports showed considerable variation in performance.
The data reveals interesting patterns across different regions and port sizes, with some of the most substantial month-over-month changes occurring at major Asian and North American gateways. Weather events and ongoing geopolitical factors likely contributed to operational challenges during the peak summer shipping period.
Significant increases at key Asian ports
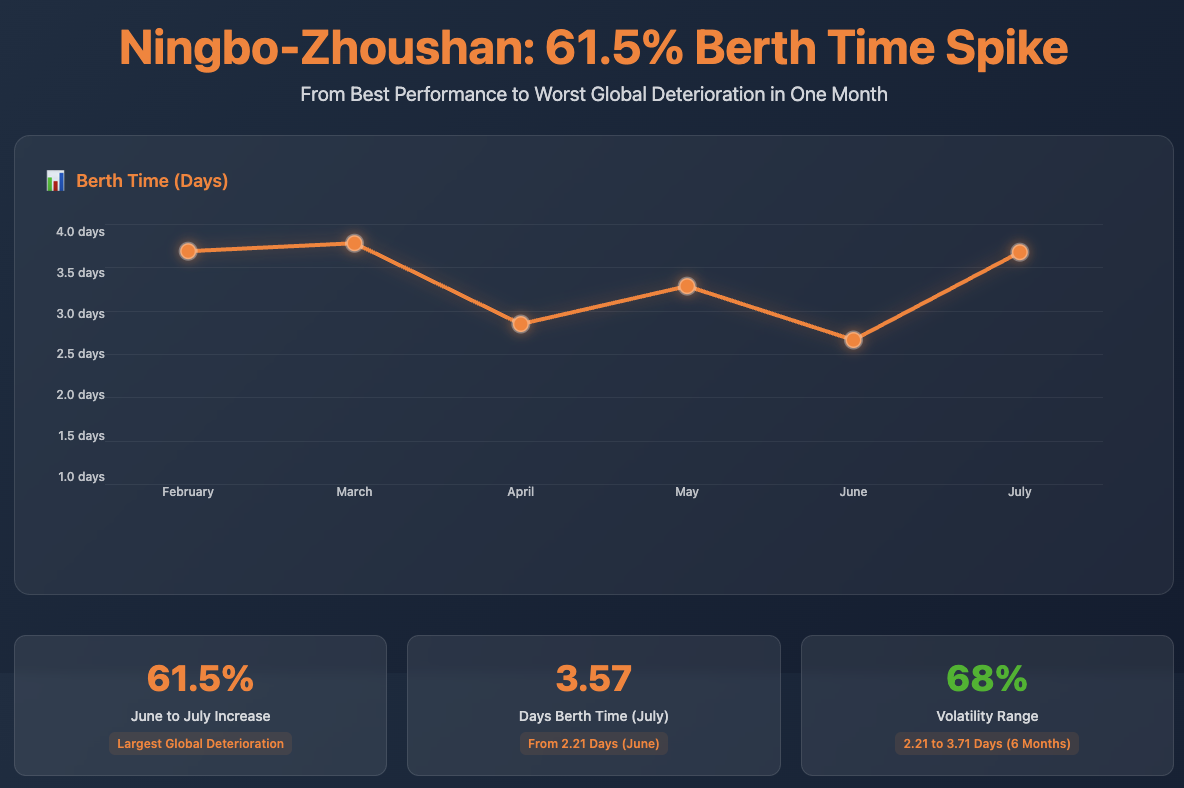
Ningbo-Zhoushan recorded the largest absolute berth time increase globally, rising 61.5% from 2.21 to 3.57 days between June and July 2025. This substantial change at China's third-busiest container port represents the most notable month-over-month deterioration in our dataset and warrants attention from supply chain managers routing cargo through this gateway.
Other Chinese ports generally maintained more stable performance, with Shanghai showing a modest 7.1% increase and several ports like Nantong (-18.8%) and Qingdao (-3.6%) actually improving their berth times. This suggests that Ningbo-Zhoushan's challenges were port-specific rather than indicative of broader Chinese port system issues.
North American ports show mixed performance
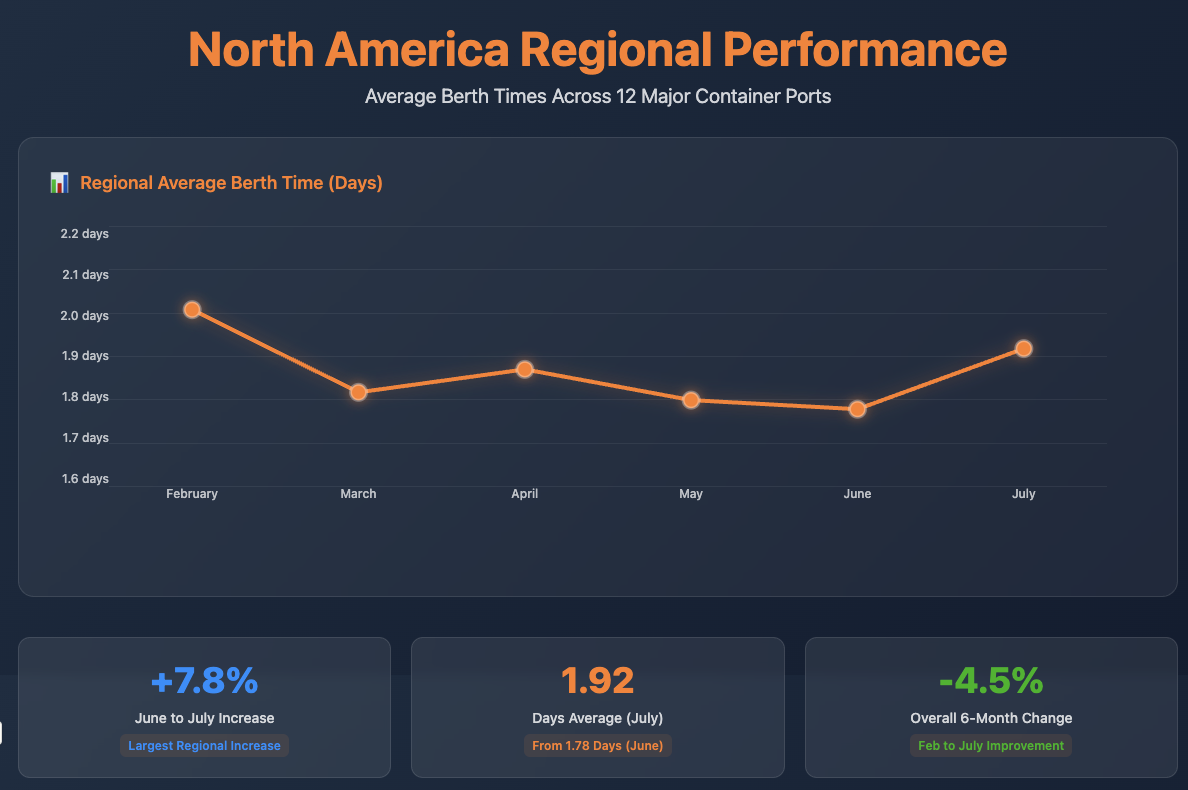
North America recorded the largest regional berth time increase in July 2025, with an average +0.139 days across 12 major ports according to our data. However, this regional average masks significant variation between individual ports.
Long Beach experienced the second-largest absolute increase globally, with berth times rising 44.1% from 2.27 to 3.27 days. Meanwhile, Los Angeles maintained the highest absolute berth time at 3.67 days, though with a 4.3% increase from June. These figures indicate increased processing times at America's two busiest container gateways during the peak summer season.
Other North American ports showed varied performance, with Houston recording an 8.1% increase and Kingston up 15.0%, while Vancouver achieved a 6.3% improvement. This variation suggests that challenges were not uniformly distributed across the region's port network.
European ports amid unprecedented congestion crisis
European ports showed particularly mixed performance in July 2025, with some experiencing severe operational challenges during a period of significant regional congestion. Gdansk recorded the third-largest absolute increase globally at 46.7%, with berth times rising from 1.35 to 1.98 days.
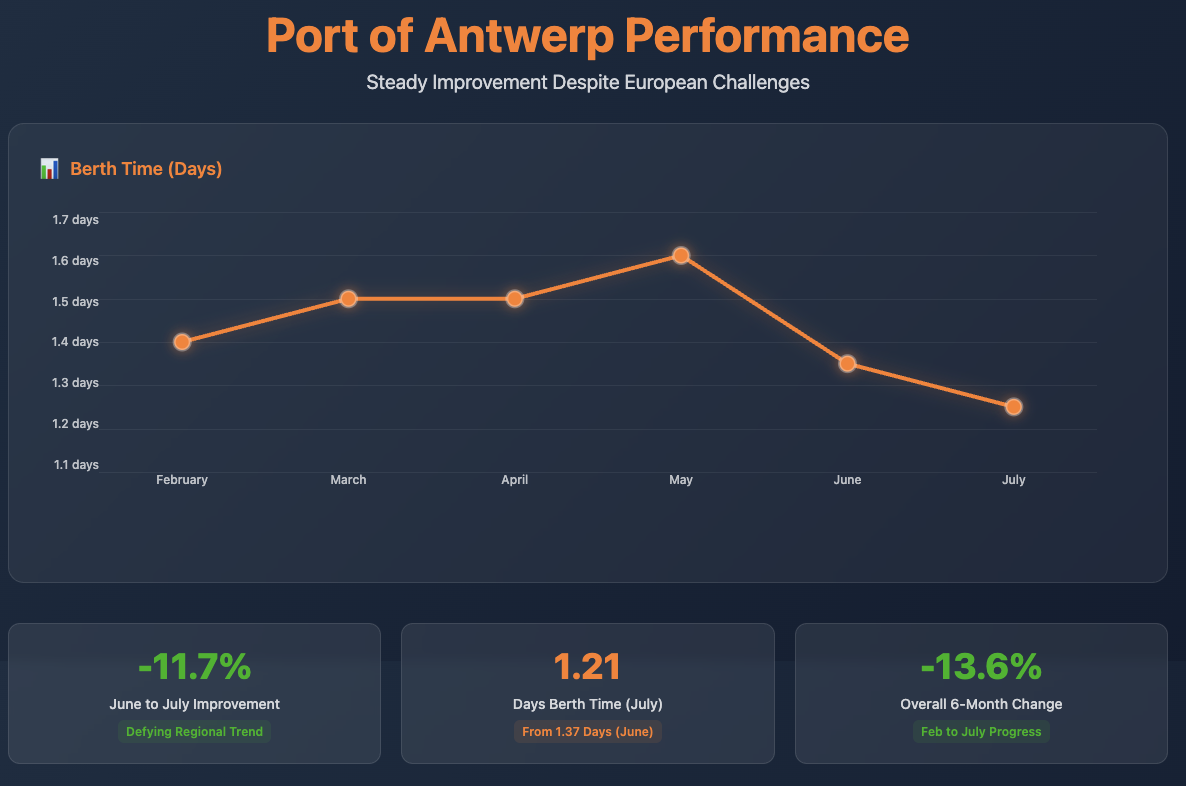
However, several major European ports achieved efficiency gains despite the broader regional crisis. Antwerp improved berth times by 11.7%, declining from 1.37 to 1.21 days, while Liverpool achieved a 15.3% improvement and Piraeus improved by 10.2%. These positive results demonstrate that operational improvements remained achievable despite broader market challenges.
The European port situation had been particularly challenging earlier in 2025, with Port of Antwerp-Bruges CEO Jacques Vandermeiren stating in May: "The congestion is more severe and complex than it was during the COVID pandemic. Calling it busy is putting it mildly. Chaos is a better word." In July, Antwerp have seen improvements since May, but probably not enough for their CEO to be out of the chaos.
Rhine River crisis compounds European challenges
A critical factor in European port congestion was the Rhine River water crisis, which created direct operational impacts on major ports. Rhine River water levels reached critically low levels in 2025, with discharge at only 1,150 cubic meters per second in April—less than half of typical levels. These restrictions forced barges to operate at reduced capacity, creating lasting impacts at major ports. Rotterdam experienced severe barge delays, with Contargo reporting wait times reaching 163 hours (nearly 7 days) at their peak. We have only just seen at the beginning of July the Rhine return to ‘normal’ levels after heavy rainfall.
The confluence of Rhine restrictions, alliance restructuring, labor strikes, and Red Sea diversions created what industry analysts characterized as multiple overlapping crises affecting European port performance throughout the summer period.

Market context and contributing factors
July 2025 berth time variations occurred against a backdrop of several ongoing industry challenges. Weather disruptions, including tropical storms affecting Asian shipping lanes, likely contributed to operational complexities during the period.
The continued Red Sea shipping diversions and longer transit times also affect global schedule reliability and equipment positioning, creating additional operational pressures at destination ports. These factors, combined with typical peak season volume increases, likely influenced the berth time patterns observed in July 2025.
Operational challenges and capacity constraints
Equipment positioning and container availability continue to present challenges across various global ports. Industry reports suggest ongoing constraints in equipment availability, which can contribute to extended vessel turnaround times when containers are not readily available for immediate loading and discharge operations.
These operational factors may partially explain some of the berth time increases observed in Our July 2025 data, particularly at ports handling high container volumes during the peak summer shipping period.
Strong efficiency improvements at select ports
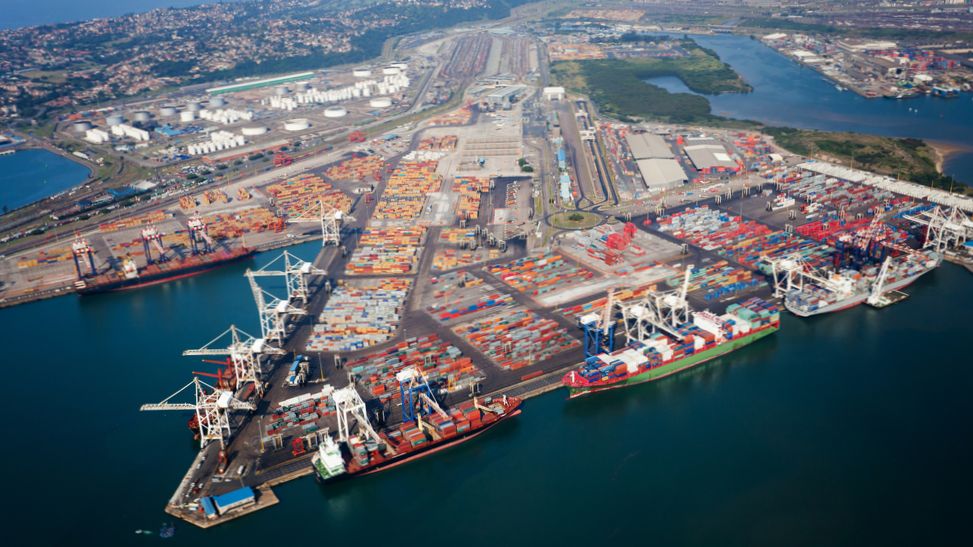
Several ports achieved substantial efficiency improvements in July 2025, demonstrating that operational gains remain possible even during challenging market conditions. Durban, South Africa recorded the most significant improvement globally, with berth times decreasing 13.7% from 3.44 to 2.97 days between June and July.
Other notable improvements included St Petersburg (-15.6%), Vancouver (-6.3%), Liverpool (-15.3%), and Laem Chabang (-24.5%). These results highlight that efficient operations and process improvements can deliver measurable benefits even during periods of industry-wide challenges.
Technology adoption continues
Ports worldwide continue investing in automation and digital technologies to enhance operational efficiency. Smart port initiatives, automated container handling systems, and AI-powered optimization tools are becoming increasingly common as ports seek to improve productivity and reduce operational variability.
These technological investments are helping ports maintain more consistent operations and may partially explain why some facilities achieved improved berth times despite broader market challenges in July 2025.

What is Supply Chain Intelligence?
.png)