Beacon’s supply chain visibility and collaboration platform empowers organizations to achieve more efficient, reliable and sustainable supply chains.
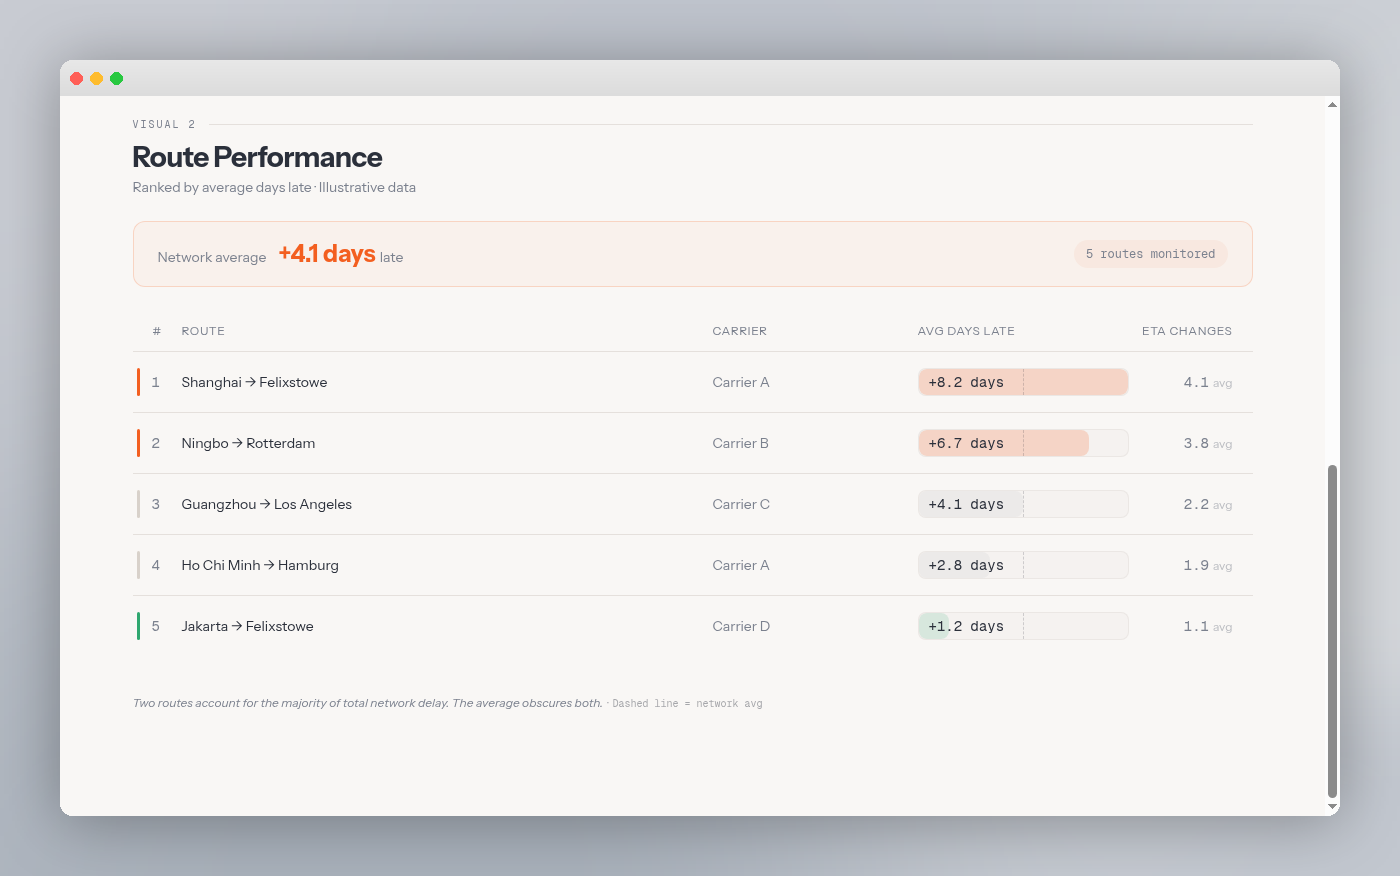
Global Port Performance: November
Vietnam's Origin Ports Hit a Breaking Point in 2025 And Most Food Importers Missed It
Your shipment tracking may say "in transit." But if you're importing Vietnamese coffee or seafood, there's a good chance your container isn't moving. It could be sitting in an origin port terminal for over a week before the vessel even leaves.
Vietnam's two main export ports serving the US food trade saw container dwell times more than double this year.
What Happened in Vietnam
At Vung Tau, containers averaged 67.9 hours (2.8 days) in January 2025. By November, that figure had jumped to 229.7 hours (9.6 days) a 238% increase. Ho Chi Minh City followed the same pattern: 116.4 hours in January, 190.3 hours in November.
Both ports operated normally through February. Then something happened between March and June. Dwell times spiked to 8-10 days and never recovered. They stayed elevated through the rest of the year.
Several developments coincided with that March-June window. In May, Saigon Newport Corporation announced a congestion mitigation plan for Cat Lai Port, which handles nearly 50% of Vietnam's container throughput. The Vietnam Association of Seafood Exporters reported that 30% of Mekong Delta export orders were delayed in May 2025 due to container shortages. By June, carriers had imposed peak season surcharges. Regional pressure built throughout the period, with Southeast Asian ports accounting for 23% of global vessel capacity waiting for berths by mid-2025.
We can't definitively say what caused the spike port capacity limits, equipment shortages, carrier scheduling changes, or some combination. But the fact that dwell times stayed elevated for six months suggests structural problems, not temporary disruptions.
This matters because Vietnam exported $4.7 billion in coffee during the first five months of 2025, up 73.9% year-over-year in Q1. For US food importers, Vietnam is a critical source for coffee, seafood, and produce all products where time matters.
How Vietnam Compares to Other Food Export Ports
Vietnam's story stands out because of the sudden deterioration. Other major food export ports either stayed consistently problematic or actually improved throughout the year.
Ecuador and Colombia: Consistently high, not getting worse
Guayaquil, Ecuador fluctuated between 152-232 hours throughout the year, averaging around 8 days. Cartagena, Colombia showed similar volatility, ranging from 150-234 hours with no clear trend up or down.
Ecuador shipped 719,153 metric tons of shrimp in the first half of 2025, up 17% year-over-year. For importers working these origins, the 2025 data doesn't reveal new problems it confirms that these ports have been operating with week-plus dwell times consistently.
The difference from Vietnam is predictability. You can plan around consistent 7-9 day dwell. You can't plan around a port that suddenly triples its dwell time mid-year.
Peru and Panama: Steady monthly improvements
The monthly data reveals that these weren't sudden improvements they were consistent, progressive reductions.
Callao, Peru started at 138 hours in January and dropped steadily month-by-month to 59.3 hours by November. Every single month showed improvement.
Balboa, Panama's trend is even more dramatic: 177 hours in January, then a sharp drop in February to 83 hours, continuing down to just 31 hours by November. The improvements were consistent and sustained.
Both improvements coincided with major infrastructure investments. DP World's Bicentennial Pier expansion at Callao, inaugurated in June 2024, drove an 80% increase in operational capacity to nearly 3 million TEUs annually. Panama's improvements aligned with the canal's recovery from drought restrictions and Balboa's record container volumes, up 13.7% in 2024.
Whether infrastructure directly caused the improvements or other operational factors played a role is unclear. But the month-by-month trajectory shows sustained operational gains, not one-time flukes.
Brazil: Gradual, consistent improvement
Santos shows a different pattern from Panama and Peru not a dramatic drop, but steady month-over-month improvements. The port went from 161 hours in January to 89 hours in November, declining consistently almost every single month.
Yet industry reports described 84% of vessels at Santos facing delays averaging 12 days throughout 2024-2025. This suggests different bottlenecks container processing within terminals sped up even as overall port congestion persisted.
How do food importers cope?
The USDA projects horticultural products will represent 49% of US agricultural import value in fiscal year 2025. Food importers can't abandon Vietnam, Ecuador, or Colombia these origins provide products US consumers want at prices that work. But the 2025 data suggests practical adjustments:
For Vietnam sourcing:
Build 7-10 extra days into lead times and delivery commitments. What used to be 21 days ocean transit is now 28-31 days including origin dwell. Negotiate extended free time at origin in carrier contracts, or structure contracts so detention only starts after vessel departure rather than terminal gate-in.
Evaluate alternatives:
Peru's 2-3 day dwell versus Ecuador's 7-9 days translates to a full week of reduced detention costs and earlier market arrival. The monthly trends show Peru's improvements weren't a fluke they were sustained across 10 months. If your products can source from Peru instead of Ecuador or Colombia, the dwell time difference is material.
Diversify when possible:
If sourcing Vietnamese coffee, consider spreading containers across multiple origin ports rather than concentrating everything through Ho Chi Minh City or Vung Tau.
The ports that improved in 2025 Peru, Panama, Brazil show that change is possible. The monthly trends prove these weren't statistical anomalies but sustained operational improvements. Whether Vietnam's ports follow that path in 2026 remains to be seen. But the 2025 baseline is clear: origin port dwell deserves the same attention destination ports get. It's earlier in the supply chain, harder to see, and just as expensive when it goes wrong.

Beacon Insider: March

.png)