
.webp)
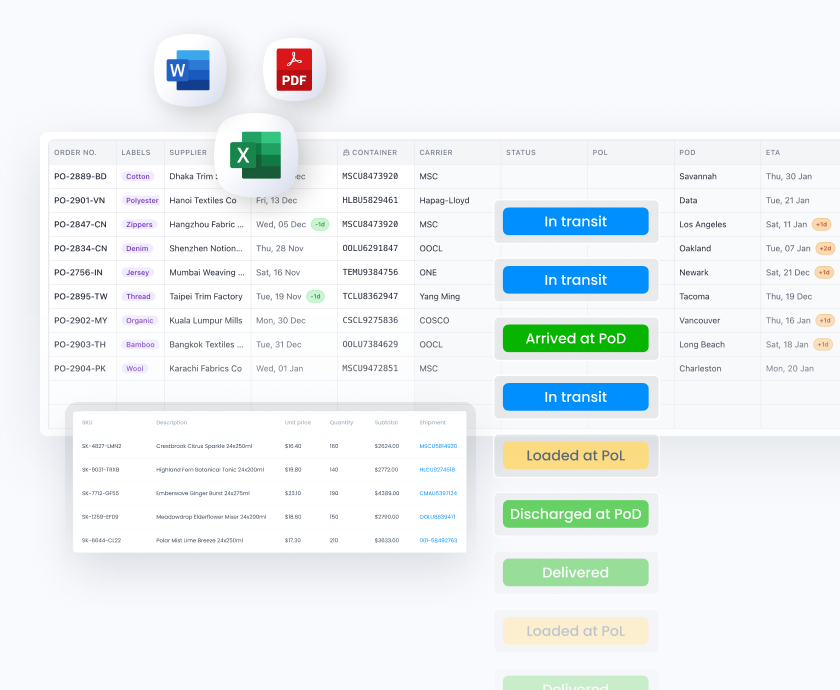
How accurate were ETAs in 2025 for ocean freight?
Supply chain leaders know how to plan for delays, it's in their blood. What is more difficult though is planning for volatility at this magnitude.
Our analysis of ocean freight shipments across 2024 and 2025 reveals a fundamental shift: not just that things got worse, but that they became dramatically more volatile. On-time delivery rates (measured as arrivals within 12 hours of the estimated time of arrival) fell from 36.0% to 13.9% year-over-year. More concerning: shipments arriving three or more days late increased from 18.1% to 47.4%.
But the headline numbers only tell part of the story. The real challenge for supply chain teams wasn't just lower reliability - it was the wild month-to-month swings that made planning nearly impossible.
The New Normal
The real story isn't just that performance declined - it's how wildly it swung from month to month. Looking at the monthly on-time rates across all shipments in 2025 reveals dramatic volatility:
This isn't gradual degradation. It's a supply chain that can swing from barely functional (6-7% on-time) to relatively stable (18-22%) and back again within weeks. For teams trying to forecast inventory needs or commit to customer delivery dates, this level of volatility renders historical data nearly useless.
Three Months Where Nothing Arrived On Time
If 2025 had a low point, it was the first quarter. February through April recorded the worst performance in the entire two-year dataset:
- February: 6.7% on-time, 63.9% very late
- March: 7.4% on-time, 63.2% very late
- April: 6.0% on-time, 61.4% very late
For three consecutive months, approximately 93% of shipments failed to arrive within the on-time window. This wasn't an isolated incident or single port congestion event - it was a global pattern affecting trade lanes worldwide.
Then May arrived, and on-time rates jumped to 18.5%. The improvement was welcome but brief, and the whiplash was disorienting. Teams that had adjusted their safety stock assumptions upward in response to the Q1 disaster suddenly faced better performance in May, only to see it deteriorate again through summer and fall.
The 1-in-7 Gamble
In 2024, achieving a 36% on-time rate meant that roughly one in three shipments hit their window. Not perfect, but predictable enough to plan around. In 2025, with just 13.9% on-time, the mindset had to shift entirely: the default assumption became that shipments would be late.
But the real planning challenge wasn't the lower baseline - it was the lack of consistency. Some routes that had been reliable in 2024 saw on-time rates drop by 40-50 percentage points. Others that had been problematic showed modest improvement. A small number actually performed better in 2025 than 2024.
This variance means that blanket assumptions don't work. Every route, every carrier, every month became its own data point, with limited predictive value for the next shipment.
Why Your Safety Stock Calculations Stopped Working
For supply chain teams, this volatility creates compound challenges:
Safety stock becomes a moving target. Traditional buffer calculations assume some level of consistency in delay patterns. When a route swings from 0% to 91% on-time across different months, how much buffer is enough? Too little, and you stock out. Too much, and you tie up capital and warehouse space unnecessarily.
Customer commitments become risky. When you can't reliably predict whether a container will be two days early or five days late, providing delivery dates to customers becomes problematic. Many companies have abandoned specific dates entirely, defaulting to wider windows that erode confidence.
Reactive planning displaces strategic planning. When this month's data doesn't predict next month's performance, teams shift from strategic planning to reactive firefighting. Resources that should go toward optimization instead go toward managing exceptions.
The cost of flexibility increases. Volatility forces companies to build in redundancy: dual sourcing, air freight backup options, expedited logistics alternatives. Each adds cost that wouldn't be necessary in a more stable environment.

What Broke (And Why It Stayed Broken)
Several factors likely contributed to 2025's volatility:
Routing disruptions forced carriers to adjust sailing patterns repeatedly throughout the year, creating cascading schedule impacts that rippled through networks.
Port infrastructure constraints became more visible as certain gateways struggled with demand, while others had spare capacity. The imbalance created unpredictable bottlenecks.
Weather patterns in early 2025 may explain some of the February-April trough, though the lack of recovery to 2024 levels suggests structural issues beyond weather.
Network consolidation concentrated cargo onto fewer routes, potentially overwhelming capacity on those lanes while leaving others underutilized.
What's clear is that 2025 represented not just a decline in performance, but a fundamental increase in unpredictability.
How to Plan When You Can't Predict Anything
When the baseline shifts from "mostly predictable with some delays" to "highly volatile with frequent severe delays," planning approaches must adapt:
Scenario planning replaces point forecasting. Instead of planning for "the container arrives on X date," teams need best-case, expected-case, and worst-case scenarios for every shipment, with contingency plans for each.
Real-time visibility becomes critical. When ETAs shift dramatically, early warning systems that alert teams to developing delays become more valuable than the original ETA itself.
Communication strategies shift outward. Internal teams need earlier visibility into potential delays so they can proactively manage customer expectations rather than reactively explain missed commitments.
Supplier relationships require adjustment. When ocean freight reliability erodes, terms around lead times, inventory consignment, and responsibility for delays need renegotiation.
Methodology Note: This analysis examines ocean freight shipments across 2024 and 2025. On-time performance is defined as arrival within ±12 hours of the estimated time of arrival. Data represents actual arrival times compared to carrier-provided ETAs across multiple trade lanes and carriers.
Analysis based on Beacon customer data 2024-2025
What is an AI Supply Chain Workspace?


How Long Does It Take to Ship Cargo from Mundra to Savannah?
