
.png)
Supply Chain Performance: The Questions Every Leader Should Be Able to Answer
Part one of three. Part two covers risk. Part three covers cost.
What is supply chain performance, and how do you measure it?
Supply chain performance is the degree to which shipments arrive when expected, across all active lanes and carriers. The standard measure is on-time arrival rate: the percentage of shipments that arrive within a defined tolerance of their original estimated time of arrival.
The standard tolerance for ocean freight is plus or minus three days. For air freight, it is plus or minus one day. A shipment arriving within that window is considered on time. Outside it, it is delayed.
Most supply chain leaders believe they have a handle on performance. Most don't. They have visibility into individual shipments. That is not the same thing.
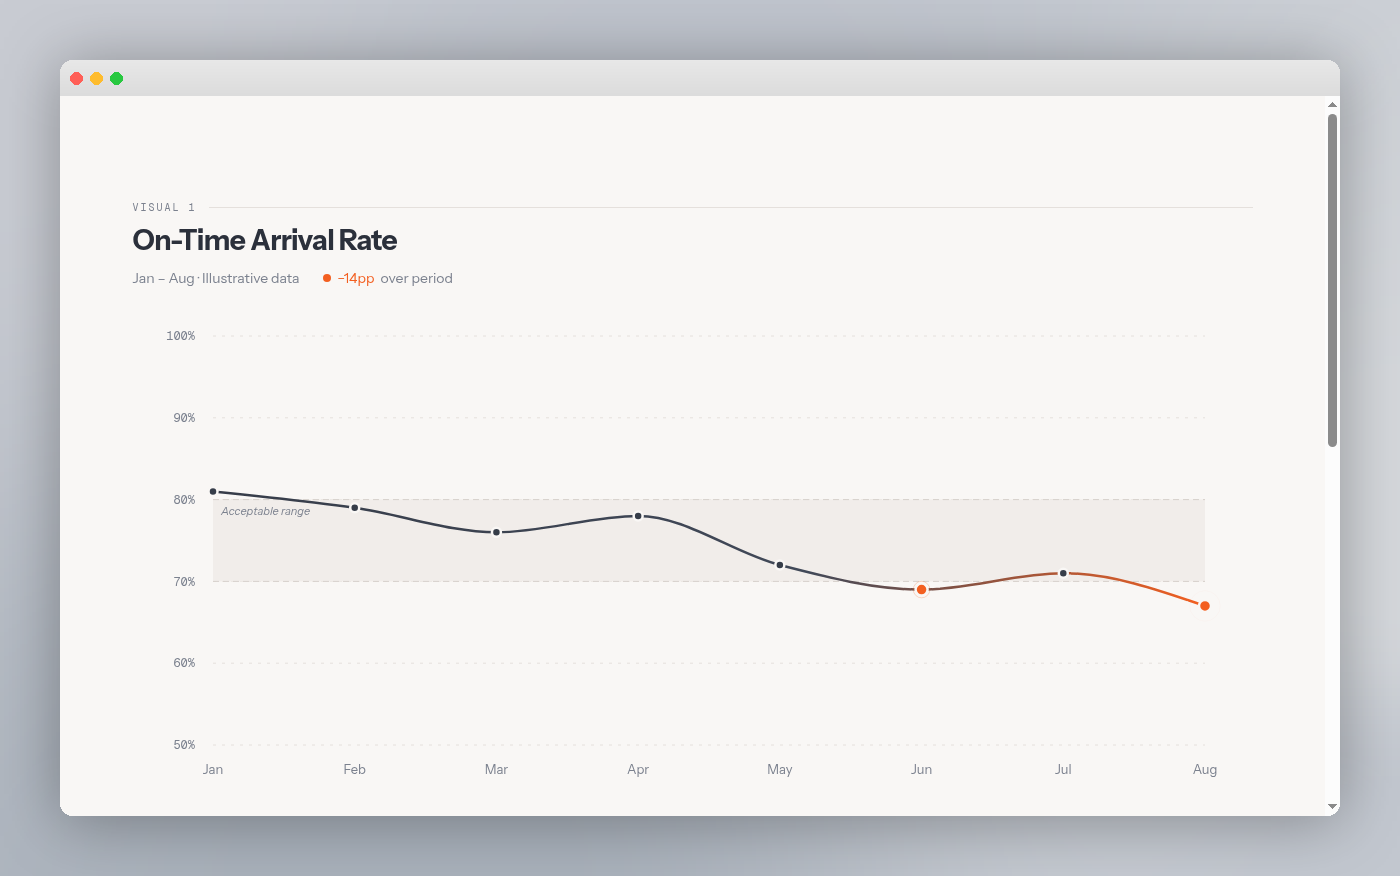
Question 1: What is my network's on-time arrival rate right now?
This is the foundational performance metric. It answers: of all active shipments currently in transit, what percentage are on track to arrive within three days of their original ETA?
A single on-time rate is a starting point. The number that matters more is what it is doing over time. A 74% on-time rate after six months of improvement is a fundamentally different situation to a 74% on-time rate after six months of decline. The trend is the signal. The snapshot is just context.
The harder question is: do you actually know your number right now, or would producing it require someone to pull data from a TMS, cross-reference a spreadsheet, and come back to you tomorrow? For most businesses, it is the latter. On-time rate sounds like a simple calculation until you realise it requires your original ETA, your current ETA, and your actual arrival data -- three data points that typically live in three different places, maintained by different teams, updated on different schedules.
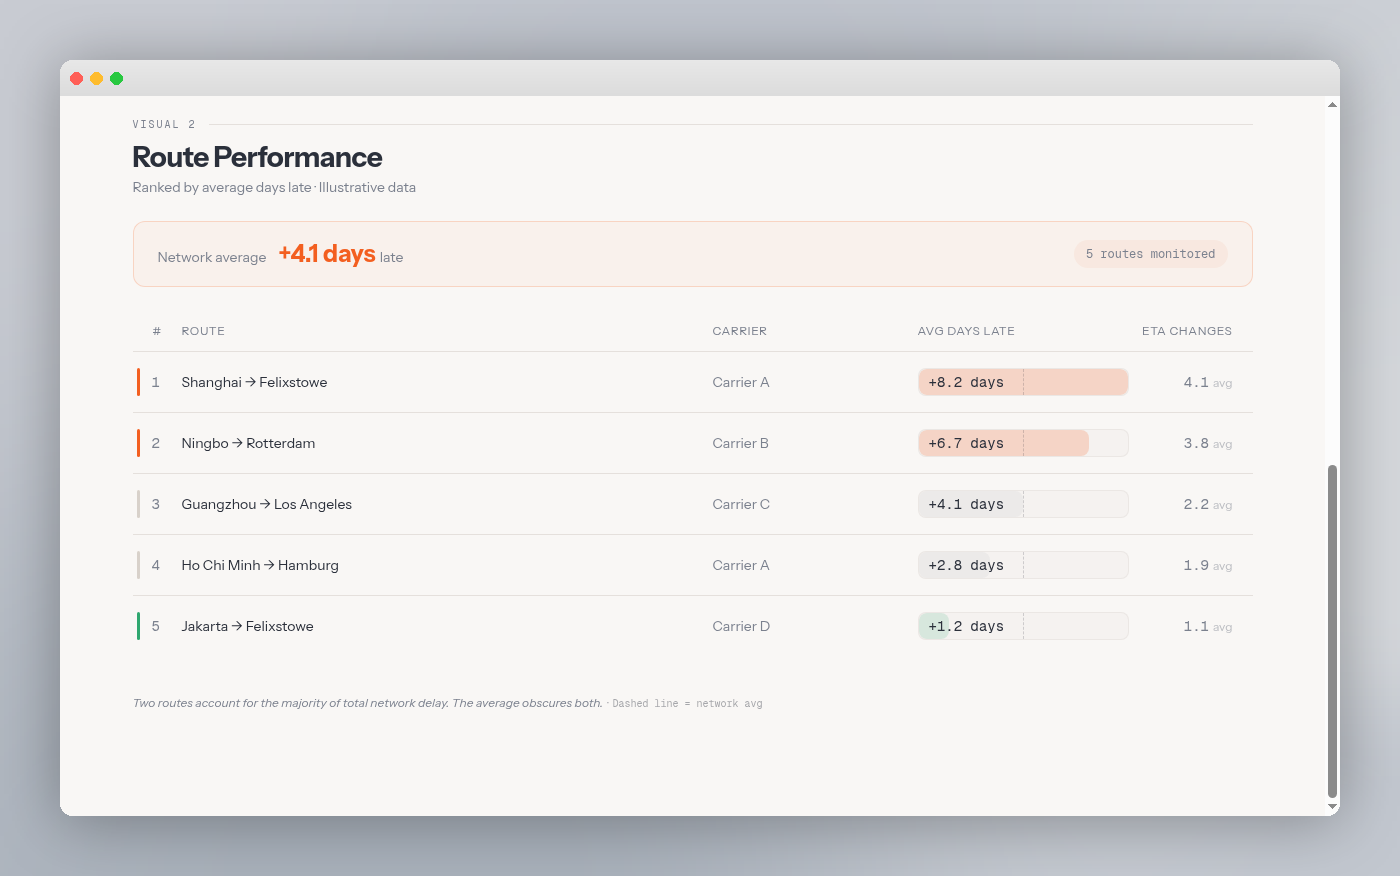
Question 2: Which routes and carriers are driving my delays?
Network-level on-time performance tells you how the business is doing. Route and carrier-level performance tells you what to do about it.
The average always hides the outliers, and in supply chain, the outliers are where the operational and commercial attention needs to go. A single underperforming lane can drag a network average down by five or six percentage points. Without route-level data, you cannot see it.
The metric to run: average days late per carrier-route combination, ranked worst to best, across completed shipments in the last 90 days.
The question worth sitting with: could you produce this breakdown by carrier and route, ranked, without asking your team to build it manually? Route-level performance data requires shipment records, carrier data, and ETA history to be connected in one place. Most businesses have all three data sources. Almost none have them joined.
Question 3: Is my network becoming more or less predictable?
On-time rate measures outcomes. ETA volatility measures instability before the outcome.
ETA volatility is calculated as the average number of ETA changes per shipment combined with the average size of those changes in days. A shipment whose ETA moves five times before arrival is structurally unpredictable, even if it ultimately arrives on time. High ETA volatility on a specific lane often surfaces before delays fully materialise, giving operators a window to act.
The question this raises is whether you would even know if volatility was rising on a specific lane. Spotting it requires tracking ETA changes per shipment over time, not just the most recent ETA. That is a level of historical data capture that most tracking tools do not surface by default. The data exists in carrier systems and port notifications. Whether it is being captured, connected, and monitored is a different question entirely.
Why these questions are harder to answer than they look
None of these three questions are conceptually complex. The challenge is not understanding what on-time rate means or why route performance matters. The challenge is that answering them in real time, continuously, across an entire network, requires data from multiple sources to be connected and current simultaneously.
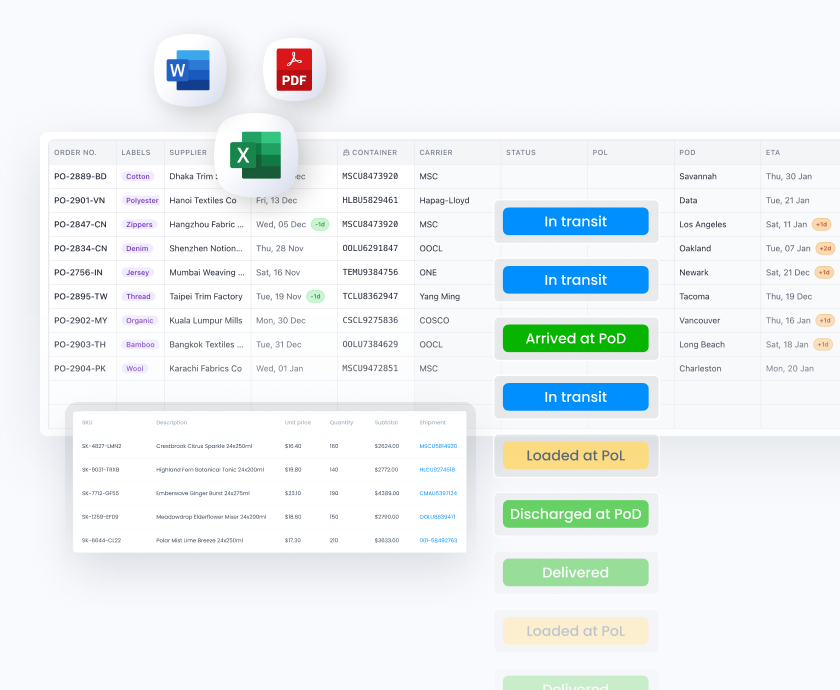
Original ETAs live in booking systems. Current ETAs come from carrier tracking. Actual arrival times come from port systems or freight forwarders. PO data lives in an ERP. In most businesses, these sources are not connected. Performance management therefore becomes a manual exercise, done periodically, based on whatever data someone was able to assemble. By the time the picture is complete, it is already out of date.
The leaders who manage performance most effectively are not the ones with the best instincts. They are the ones who have stopped relying on instinct because they can see the data directly.
What is an AI Supply Chain Workspace?


How Long Does It Take to Ship Cargo from Mundra to Savannah?
.webp)