Beacon’s AI Supply Chain Workspace turns fragmented data into intelligent supply chains - focusing on reducing unnecessary spend across the supply chain.
Global Port Performance: August 2025
North American Port Performance Special
How Are The Ports Faring? January-August 2025
Across North America's key maritime gateways, the 2025 performance picture reveals consistent patterns of operational efficiency and areas for improvement
Eight months into 2025, North America's major ports show varied performance across anchor times, berth processing, and container dwell periods. The data provides clear insights into which gateways are maintaining operational efficiency and which face ongoing challenges with processing capacity and coordination.
Understanding these performance differences helps supply chain professionals make informed routing decisions and capacity planning choices. For comprehensive global port performance data and real-time supply chain visibility, explore Beacon's tracking solutions.
Regional Performance Overview
The performance overview shows West Coast ports with the widest efficiency variation, East Coast facilities delivering more consistent results, and specialized gateways like Houston and Kingston operating with different performance characteristics due to their cargo mix and operational focus.
Anchor Times: Harbor Access Efficiency
Vessel waiting times before berth assignment indicate harbor coordination effectiveness
Average Anchor Waiting Times (Hours)
Seattle/Tacoma maintains the most efficient harbor operations with minimal anchor waiting throughout 2025. The coordination between terminals, pilot services, and harbor management creates smooth vessel flow.
Los Angeles shows notable improvement from over 12 hours in January to under 2 hours by August. The operational changes demonstrate measurable progress in harbor efficiency.
Savannah experiences variable performance with month-to-month changes ranging from 5 to 25+ hours, creating challenges for precise delivery scheduling. Track your shipments in real-time to navigate these port variations effectively.
Berth Times: Vessel Processing Efficiency
Time at berth reflects terminal productivity and cargo handling capacity
Average Berth Processing Times (Hours)
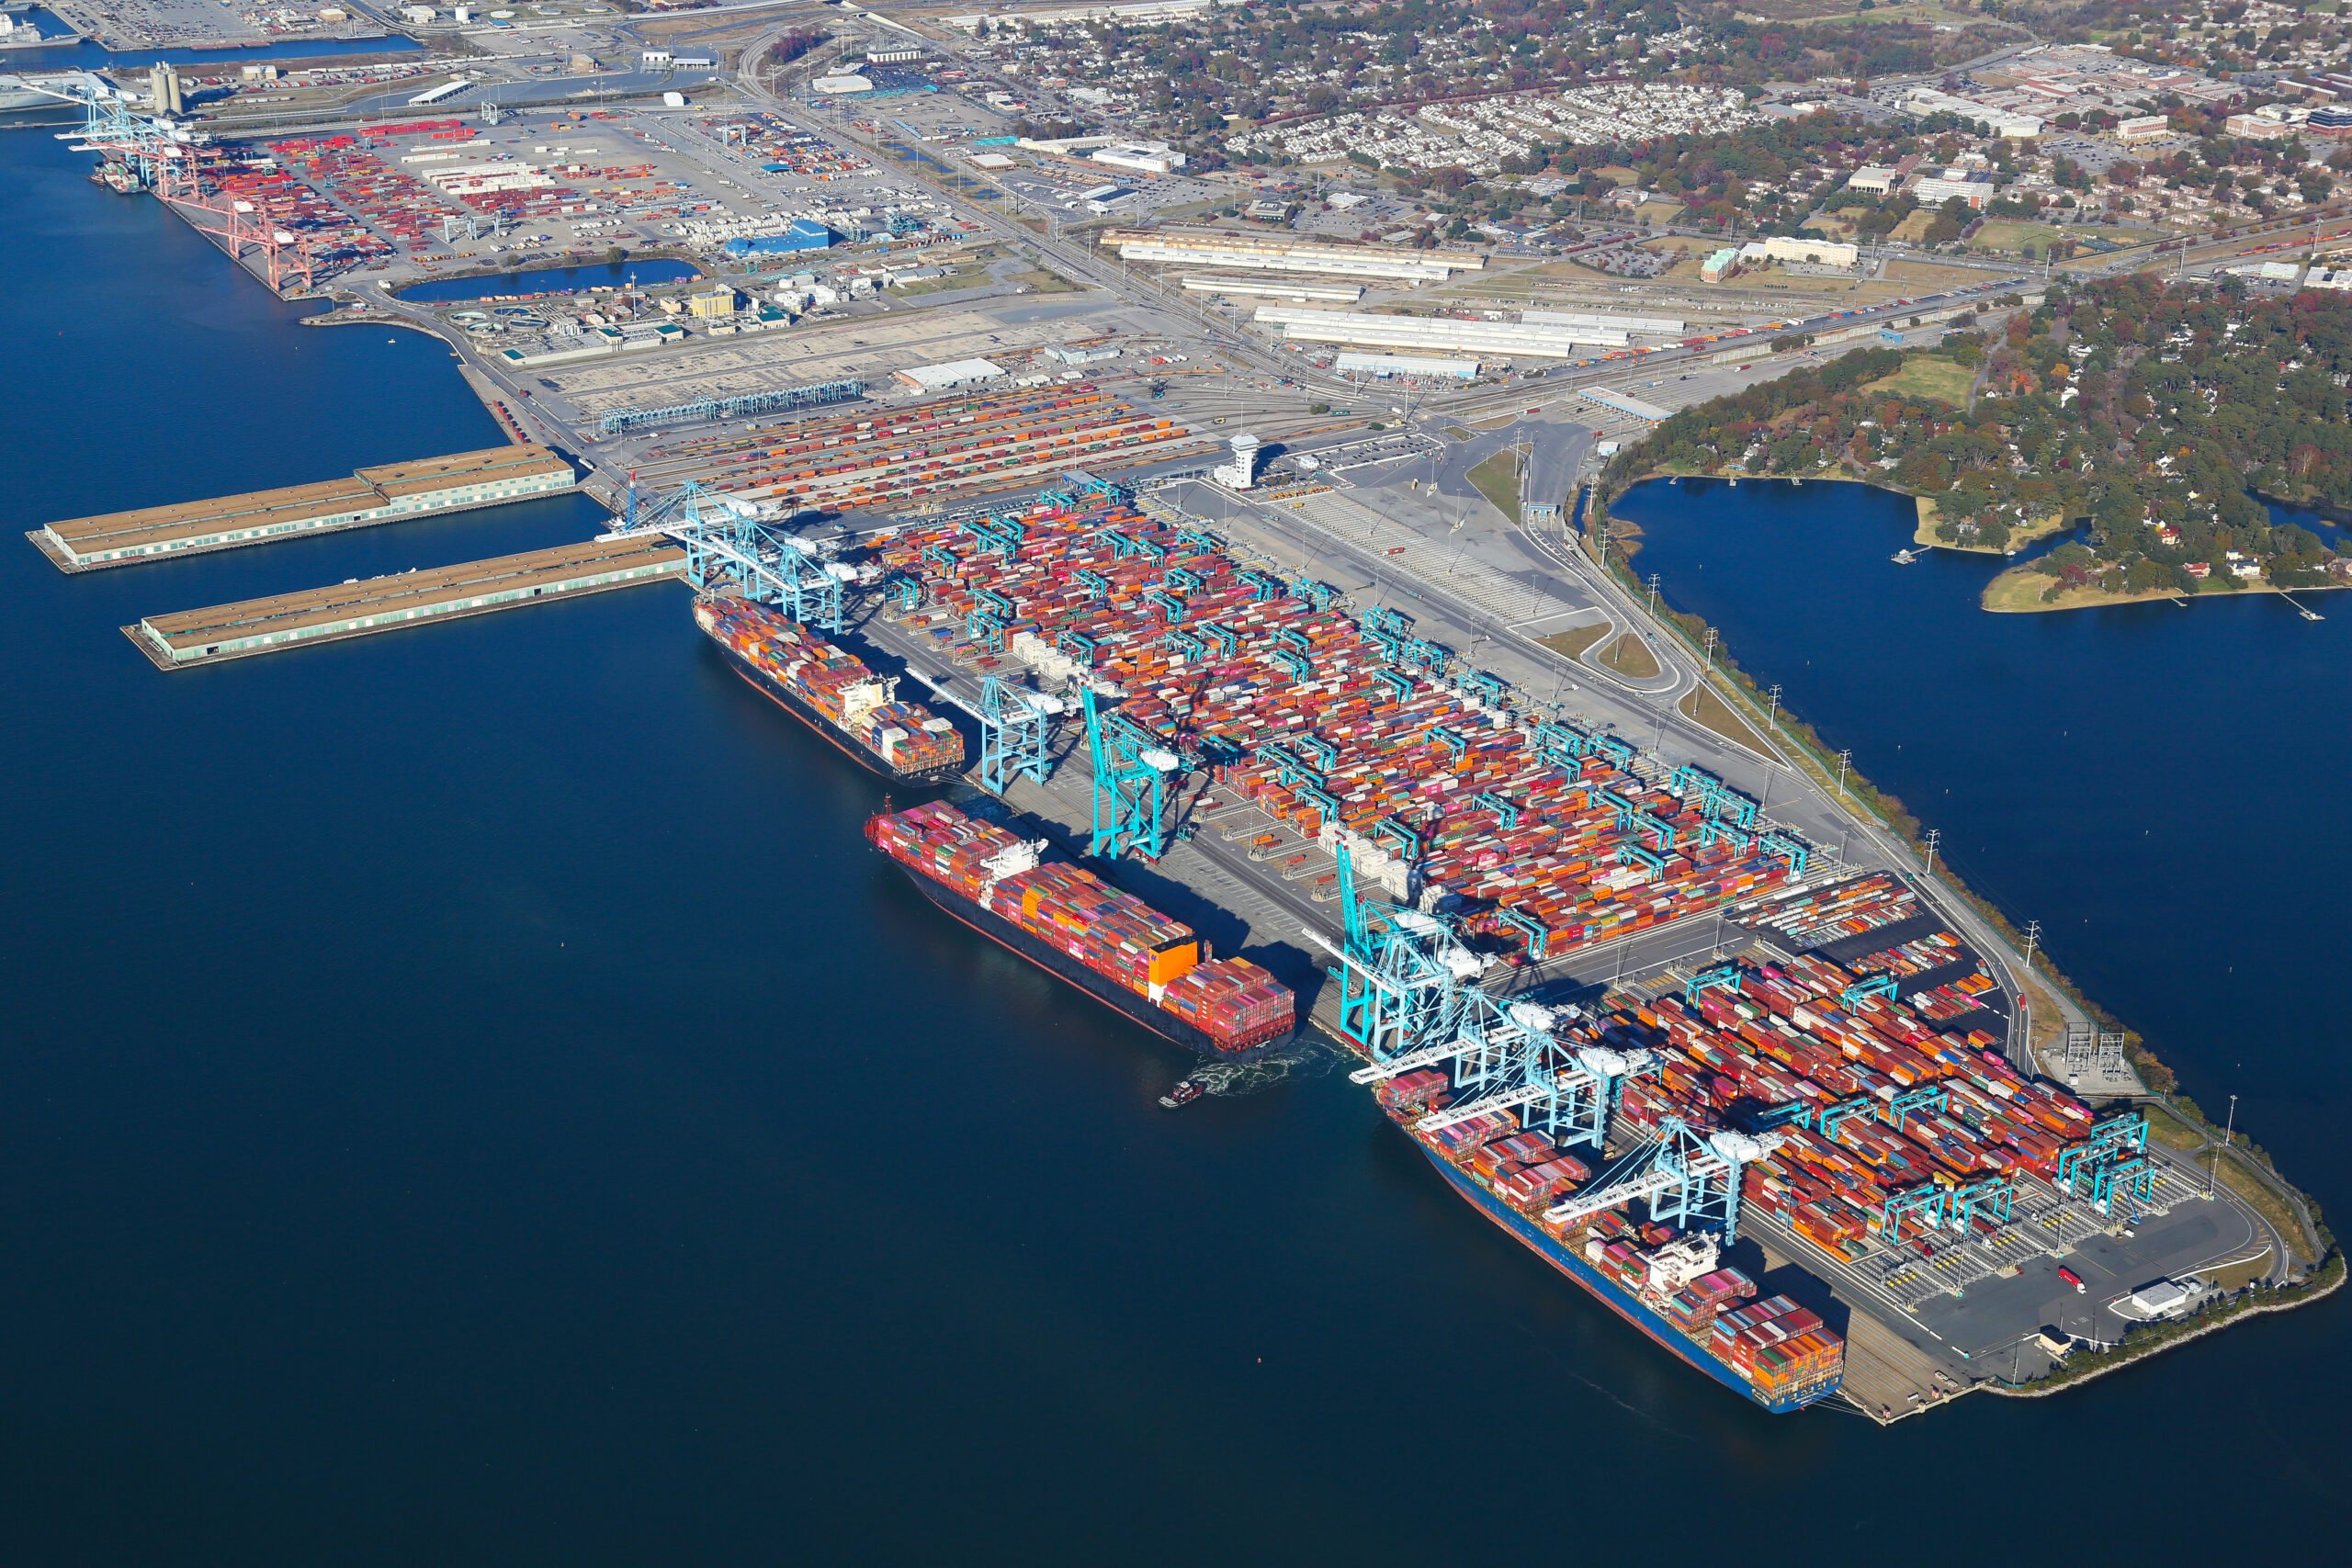
East Coast ports generally demonstrate more efficient berth operations. Norfolk, Charleston, and New York/New Jersey maintain 1-2 day processing times while handling significant container volumes.
West Coast major ports show longer processing times, with Los Angeles and Long Beach requiring 3-4 days for vessel operations. These extended times reflect the combination of high volumes and operational coordination challenges.
Houston's processing times reflect its cargo mix of containers, energy products, and specialized commodities that require different handling procedures. Learn more about supply chain analytics to optimize your port selection strategy.
Container Dwell Times: Cargo Release Performance
Container dwell periods indicate how efficiently cargo moves from port to supply chain
Container dwell times show more consistency across most North American ports compared to vessel processing metrics. Most gateway ports maintain 3-5 day averages for cargo release.
For detailed container tracking and port performance monitoring, Beacon provides real-time visibility into these critical supply chain metrics.
Performance Trends: Eight-Month Analysis
Ports Showing Improvement
Los Angeles reduced anchor waiting times significantly, from 12+ hours in January to under 2 hours by August. The improvements in harbor efficiency demonstrate progress in operational coordination.
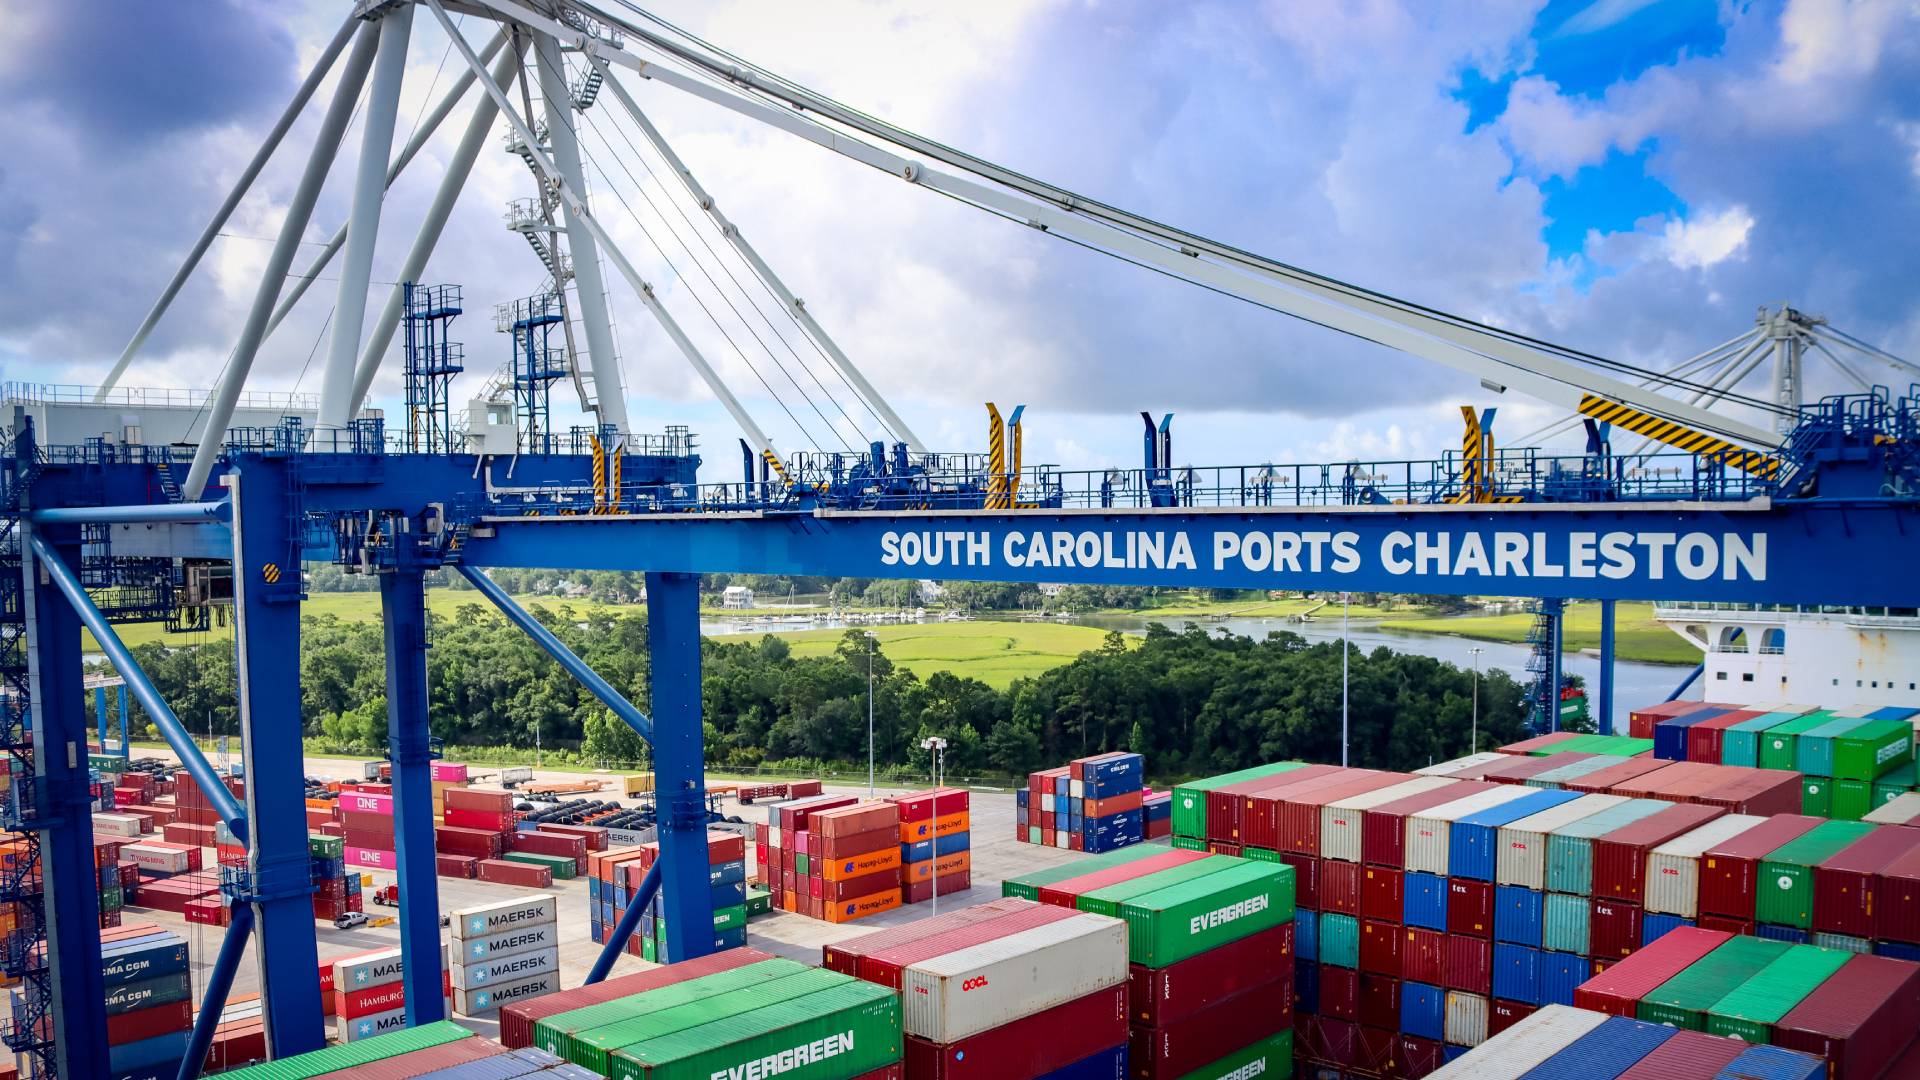
Charleston achieved steady reductions in anchor delays through consistent month-over-month improvements. The port maintains efficient berth operations while handling growing volumes.
Norfolk delivered gradual improvements across multiple metrics, combining infrastructure advantages with operational focus to enhance gateway performance.
Consistent Performers
Seattle/Tacoma maintained efficient operations across all metrics while processing increased container volumes. The port demonstrates reliable performance patterns over the eight-month period.
Vancouver showed steady operational performance with gradual improvements in some areas. The port provides consistent service levels for trans-Pacific cargo flows.
New York/New Jersey maintained adequate processing times while handling substantial container volumes, demonstrating operational stability at scale.
Ports Facing Challenges
Long Beach experienced gradual increases in berth processing times despite infrastructure investments, indicating ongoing coordination challenges between terminals and supporting services.
Savannah shows variable anchor time performance that creates uncertainty for vessel scheduling and cargo delivery planning.
Access comprehensive port performance reports to stay informed about operational changes affecting your supply chain routes.
Regional Analysis: Performance by Coast
West Coast: Mixed Performance Patterns
The Pacific Coast shows varied efficiency levels with Seattle/Tacoma delivering good performance while Los Angeles and Long Beach face ongoing operational challenges.
Infrastructure investments at California ports haven't yet translated to improved processing efficiency. Despite equipment upgrades, vessel processing times remain longer than East Coast competitors.
Oakland provides reliable operations at a smaller scale, demonstrating that mid-sized ports can maintain consistent performance with less complex coordination requirements.
East Coast: More Consistent Operations
Atlantic gateways generally maintain efficient operations while handling increased container volumes. Charleston, Norfolk, and New York/New Jersey show steady performance across most metrics.
Infrastructure improvements are supporting operational efficiency. Channel deepening and terminal expansion projects contribute to improved vessel processing capabilities.
East Coast ports offer competitive processing times that make them attractive alternatives for supply chains evaluating gateway options.
Gulf Coast: Specialized Operations
Houston's performance reflects its diverse cargo mix including containers, energy products, and specialized commodities. Processing times account for the variety of cargo handling requirements.
Gulf ports serve different supply chain functions compared to container-focused facilities, making their operational metrics reflect specialized rather than pure container efficiency.
📊 Data reflects January-August 2025 performance averages. Individual shipment experiences may vary based on vessel size, cargo type, and seasonal factors. For real-time tracking and performance monitoring, visit www.beacon.com.